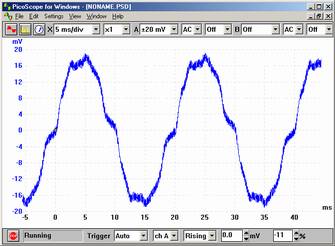
Unfiltered - this is the default display mode for PicoScope.
PicoScope uses an intelligent algorithm to map the large number of samples that can be collected using our products onto the limited number of pixels available on a monitor. Unlike some oscilloscopes, PicoScope ensures that all data collected contributes to the display. This ensures that glitches, spikes and other short duration events can be clearly seen and then expanded in detail using the powerful zoom facilities.
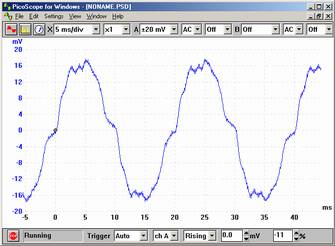
Filtered - this uses a simple filter to help remove high frequency noise from the current trace.
In the multi-cycle display modes, previous cycles affect how the current cycle is displayed. For example an area of a trace may appear a different colour depending on how often cycles pass over that area.
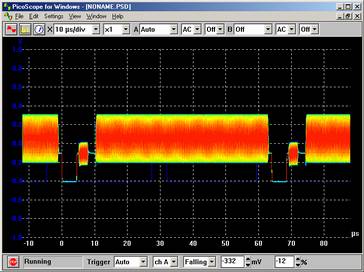
Digital Colour - This mode is ideal for spotting intermittent glitches in digital signals. The areas of the trace that have the highest population density are red (hot), the areas with the lowest population density are blue (cold). Digital colour mode does not decay over time.
Analog intensity - This mode emulates the phosphor display of a conventional analogue scope and is useful for displaying complex analogue signals such as video waveforms and analogue modulation signals. The area of the trace that has the highest population density is the strongest colour. The area with the lowest population density and/or high slewing rate (low risetime/falltime) is the lightest colour.
Average - the average of all cycles since you started. This is useful for removing random noise from the current trace.
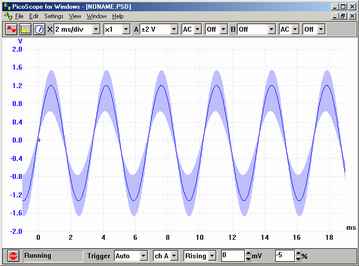
Min, max & average - a shaded area showing the minimum and maximum of all cycles since you started, with a solid line showing the average. As with average, this removes random noise from repetitive signals. In addition, this also gives an indication of how noisy a signal is.
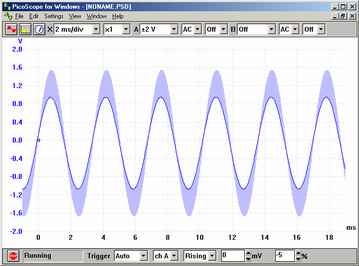
Min, max & current - a shaded area showing the minimum and maximum of all cycles since you started, with a solid line showing the current data. This mode is ideal for measuring the time jitter of signals such as clock waveforms.
USA Office
Tel:1.877.902.2979-1.425.223.4311
Fax:1.877.329.4324
Address: 1480 Gulf Road, Suite 837,
PO Box 1364
Point Roberts, WA 98281
Western Canada - Vancouver BC
Tel:1.800.663.6001 or 1.604.925.6150
Fax:1.604.925.6170
Address: 2454 Haywood Ave
West Vancouver, BC V7V 1Y1
Eastern Canada - Markham, Ontario
Tel:1.800.465.0164 or
1.905.513.7027
Fax:1.877.329.4324