PicoLog 6 released Replaced by Picolog Cloud - Details Here!
[Picolog Cloud does everything Picolog did, log to local disk or to the cloud - Free upgrade to existing Picolog]
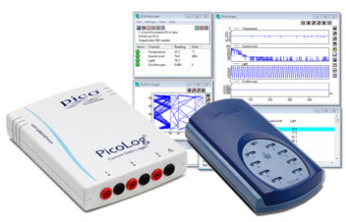
PicoLog 6 is a complete data acquisition software package. It provides a visual, easy-to-use interface for users to quickly set up simple or complex acquisitions, record, view and analyze data.
- Real-time data collection and display
- Visual logger and channel setup for easy configuration and viewing
- Available for Windows 7, 8 and 10 (32 and 64-bit), macOS and Linux
- Virtually unlimited logging capacity to PC
- Robust database format minimizes data loss and corruption
- Simple and complex programmable alarms
- ​Channels can be scaled using lookup table or equation
- Up to 4 independent graph axes
- Data can be exported as CSV, clipboard image and PDF
- Supports multiple different PicoLog data loggers on the same PC
PicoLog 6 – straightforward from the start
Designed from the ground up to be intuitive from the outset, PicoLog 6 allows you to set up the logger and start recording with just a few clicks of the mouse, whatever your level of data logging experience.
From here, starting a capture is simple: plug in the logger, add a channel, press Record, and you’re logging! PicoLog 6 also includes a number of additional features to cater for more advanced data logging needs.
PicoLog 6 views 
A simple menu bar on the left of the screen provides permanent access to the view modes of PicoLog 6 without pausing capture:
- Device settings
- Capture graph
- Saved file manager
- Software settings
- Help and support
Device settings view
The Device settings view provides a visually smart way to set up a multichannel acquisition system with multiple different PicoLog data loggers. You can instantly see the status of data loggers and acquisition channel settings. An image of the device appears for each device detected, showing which channels are enabled.
From this screen you can view and adjust settings such as adding graph axes, per-channel scaling factor, alarms, notes, graph annotations, channel naming and color, sample mode and sample interval.
Setting up Channels and Axes
The Channel and Axes settings menu is visible in both the Device settings and Capture Graph views. Once a channel is enabled and settings confirmed, you can view its connection status at a glance, along with alarm condition and current live measurement. In this menu, you can also configure alarms and view graph annotations and capture info.
Capture graph view
Viewing your data in a graph is fundamental to data acquisition applications. The PicoLog 6 graph view makes it easy to view captures, zoom and pan through large datasets, record alarm history and display when alarms occurred. It also allows you to annotate the graph with your notes and observations.
Adding additional graph axes is also essential for multi-channel logging applications where measurement units are different for every channel, or when the channels are measuring values at opposite ends of the range. For example, simultaneously measuring an internal furnace temperature of over 1000 °C and the ambient temperature at the same time requires two axes so that the detail of both is visible. You can view up to four axes with different ranges at a time.
Alarms and annotations
Maybe you’re measuring the temperature of a microbiological culture in an incubator, or strain on a concrete bridge in high winds; you’ll need to be informed when a reading exceeds acceptable tolerances. In PicoLog 6, you can set up an alarm to alert users when a parameter goes out of range. This can be configured to play a sound, display visual alerts on the screen, run a specified application such as an email or SMS client, and automatically annotate the capture graph to mark when the alarm happened and its duration.
PicoLog 6 alarms can also trigger a digital output on devices with supporting hardware, such as the PicoLog 1000 Series, ADC-24 and DrDAQ. You can even trigger a digital output from one of these devices based on an alarm condition from another connected logger without digital outputs, such as a TC-08.
Math channels
Some applications require the recording and graphing of a calculated parameter containing data from one or more measurement channels. PicoLog 6 is equipped with an equation builder to perform simple calculations such as A – B, or more complex functions such as log, sqrt, abs, round, min, max, mean and median. Math channels are treated like any normal channel, so you can perform functions like alarms, graphing and annotations on them.
Robust data file format
At the heart of PicoLog 6 is the file system which stores live capture data directly to a robust database, rather than to a single file that is prone to data loss and corruption. If the computer is shut down and rebooted, PicoLog will only lose the data during the outage and the file system will begin saving capture data once again without corruption of the file.
The file system also allows for virtually no limit on the size of dataset you can capture – only the size of the hard disk on your computer!
Another major step forward is native support for 32-bit and 64-bit Windows, various Linux distributions (64-bit only) and macOS. The new .picolog file format is compatible across all operating systems. Since anyone can download and install PicoLog 6 for free, you can share saved .picolog files with co-workers, customers and suppliers for offline post-analysis.
Exporting data
When you’re ready to export the data, you have several options. First, save the .picolog file and close the acquisition. You can save files with custom search tags to make them easier to categorize and locate later.
Exporting large datasets to CSV can often be troublesome due to file size limitations, so PicoLog 6 includes a suite of export options to narrow down the size of the whole dataset. These include downsampling, selecting channels to export or even restricting the export region to the zoomed area on screen.
Want to export a screen shot? PicoLog 6 includes a feature to export the graph as a PDF: again, select either the entire capture or the zoomed area of interest. The export to PDF format also includes options to include alarm trigger history, annotations, channel configuration and capture notes, for a complete capture report.
Download PicoLog 6 now for free!
Software Development Kit (SDK)
As well as the supplied PicoLog software, also included are drivers and examples for those who want to write your own software or interface to other programs.
Software drivers are supplied for Microsoft Windows, Apple Mac (OS X) and Linux (including Raspberry Pi and BeagleBone).
Example code shows how to interface to third-party software packages such as Microsoft Excel and National Instruments LabVIEW as well as how to write your own software in C / C#.
|
DOS Software
A DOS version of PicoLog is also supplied, but this has limited functionality in comparison to the Windows version.
|